Fusedash vs StatPecker
Side-by-side comparison to help you choose the right product.
Fusedash transforms raw data into interactive dashboards and charts for instant insights and informed decision-making.
Last updated: March 4, 2026

StatPecker
StatPecker provides fast AI insights and stunning visuals to enhance your data storytelling and presentations.
Last updated: March 1, 2026
Visual Comparison
Fusedash

StatPecker
Feature Comparison
Fusedash
Flexible Views
Fusedash allows users to create tailored dashboards, charts, maps, or report-style views from the same dataset, ensuring that different teams receive the specific insights they need without unnecessary back and forth. This customization enables stakeholders to focus on what matters most to them.
AI Chart Generator
The AI Chart Generator in Fusedash enables users to swiftly create clear and compelling visuals from CSVs or APIs. It helps users select the appropriate chart type, apply necessary comparisons, and refine labels, ensuring that the charts accurately communicate the intended story. Generated charts can be easily integrated into dashboards or used as standalone visuals.
Dashboard Software
Fusedash combines the capabilities of dashboards and reporting in a single workspace. This feature allows users to monitor KPIs while also providing contextual narrative reporting that explains changes, their significance, and future implications. This integration helps maintain alignment among teams and reduces discrepancies in reporting.
AI Chat
With the AI Chat feature, Fusedash enables users to engage with their data using plain language. Users can ask questions, explore breakdowns, and receive suggestions for relevant charts or metrics, transforming insights into shareable dashboard views that can be utilized immediately.
StatPecker
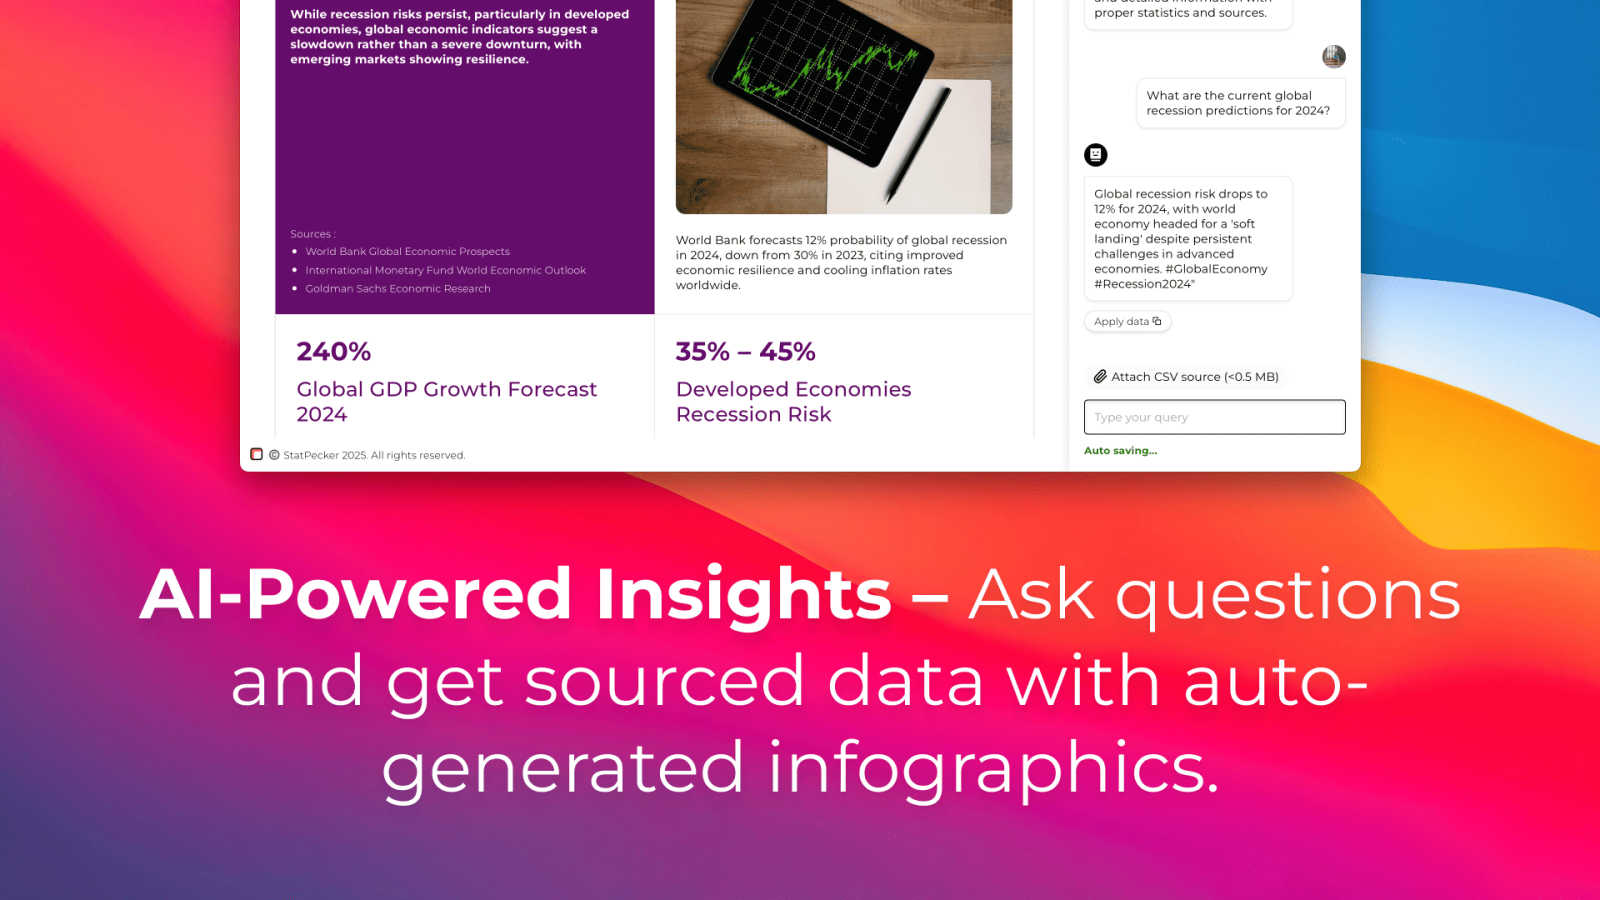
Ask Your Query
StatPecker allows users to pose questions to the AI and receive instant insights from validated sources. This feature simplifies the data exploration process, enabling users to generate answers without the need for complex tools or technical knowledge.
Publish & Embed
With StatPecker, users can create interactive visuals that can be seamlessly integrated into blogs, articles, and websites. This feature enhances the user experience by allowing for dynamic data presentations that engage audiences.
Upload & Analyze CSVs
Users can upload local CSV files (up to 50 MB) and leverage StatPecker's on-device analysis capabilities. This feature ensures that data remains private while allowing users to extract key insights without the hassle of traditional spreadsheets.
Download & Use Anywhere
StatPecker enables users to export their infographics as images for use in reports, presentations, and other formats. This flexibility allows for easy sharing and utilization of visuals across different platforms and mediums.
Use Cases
Fusedash
Marketing Performance Monitoring
Marketing teams can leverage Fusedash to create dynamic dashboards that track campaign performance in real time. By visualizing key metrics and trends, marketers can swiftly adjust strategies to optimize ROI and improve engagement.
Operational Efficiency Analysis
Operations teams can utilize Fusedash to visualize workflows and processes. By monitoring key performance indicators, they can identify bottlenecks and areas for improvement, leading to enhanced operational efficiency and productivity.
Financial Reporting
Finance teams can benefit from Fusedash by creating comprehensive financial reports and dashboards that provide a clear view of revenue, expenses, and key financial metrics. This transparency aids in informed decision-making and strategic planning.
Sales Performance Tracking
Sales teams can use Fusedash to analyze sales data and performance metrics. By creating dashboards that highlight top-performing products, sales trends, and regional performance, teams can adjust their strategies to drive sales growth effectively.
StatPecker
Content Creation
Content creators can utilize StatPecker to quickly generate stunning infographics that enhance their articles and blogs. By transforming data into visually appealing formats, they can capture their audience's attention more effectively.
Market Analysis
Analysts can leverage StatPecker to extract trends from data sets and visualize global comparisons. This capability allows them to present insights in a clear and compelling manner, facilitating better decision-making within their organizations.
Educational Presentations
Educators can harness StatPecker to create engaging visual aids for their lectures and presentations. By using infographics, they can simplify complex information, making it easier for students to grasp key concepts.
Team Collaboration
StatPecker enables teams to collaboratively analyze data and create infographics that can be shared internally. This feature enhances communication and alignment around data-driven insights, leading to more informed strategies and decisions.
Overview
About Fusedash
Fusedash is an advanced AI-powered data visualization platform designed to streamline the process of transforming connected data into clear and actionable insights. It serves as a comprehensive workspace for teams to create visually engaging dashboards, interactive charts, detailed maps, and narrative reports without the need to replicate the same logic across multiple disconnected tools. The platform's core value proposition lies in providing consistency and efficiency; users can define key performance indicators (KPIs) and metrics once and then apply these consistent definitions across various views and reports. This ensures that all stakeholders, from leadership to marketing and operations, are aligned and relying on the same trustworthy data. Fusedash is particularly beneficial for teams tired of cumbersome manual reporting cycles and inconsistent data narratives. It empowers users to monitor real-time data and delve into the reasons behind trends by exploring segments, regions, or time periods. With integrated AI capabilities such as natural language data chat and smart visualization assistance, Fusedash simplifies data exploration and reporting, transforming raw data into a reliable source of truth that drives organizational alignment and action.
About StatPecker
StatPecker is an innovative AI-powered tool designed to transform raw data into visually captivating infographics in mere seconds. This platform caters to a diverse range of users, including content creators, analysts, marketers, and educators, all of whom aspire to enhance their storytelling through effective data visualization. By eliminating the need for manual reporting or hiring expensive designers, StatPecker streamlines the process of data storytelling. Users can focus on generating insights rather than struggling with complex software. The core value proposition of StatPecker lies in its ability to save time and reduce costs while significantly enhancing the impact of data presentations. By providing quick, credible answers that can be published, presented, or shared with teams, StatPecker empowers users to communicate data effectively and engagingly. Whether you are looking to extract trends or visualize global comparisons, StatPecker is an essential tool for anyone aiming to make data-driven decisions and presentations.
Frequently Asked Questions
Fusedash FAQ
What types of data can I connect to Fusedash?
Fusedash allows users to connect a variety of data sources, including CSV files, APIs, and even public datasets. This flexibility ensures that users can aggregate their data seamlessly for comprehensive analysis.
Is Fusedash suitable for non-technical users?
Yes, Fusedash is designed to be user-friendly and accessible, enabling non-technical users to create insightful dashboards and reports without needing advanced data skills. Its AI features further simplify the process of data visualization.
Can I share my dashboards with other team members?
Absolutely. Fusedash allows users to share dashboards and reports easily, ensuring that all stakeholders have access to consistent and transparent data views, which fosters collaboration and alignment across teams.
How does Fusedash ensure data consistency?
Fusedash enables users to define key metrics and KPIs once, which can then be reused across all views and reports. This eliminates discrepancies and ensures that all teams are referring to the same reliable data for their analyses.
StatPecker FAQ
How does StatPecker ensure data privacy?
StatPecker employs on-device analysis for CSV uploads, meaning that your data remains on your device during processing. This feature ensures that no sensitive information is shared over the internet.
Can I use StatPecker for free?
Yes, StatPecker offers a free tier that allows users to engage in unlimited projects and embeds, along with a limited number of AI queries and CSV uploads. This makes it accessible for users who want to explore the tool without any initial investment.
What types of files can I upload to StatPecker?
Users can upload CSV files up to 50 MB in size. This flexibility allows for the analysis of substantial data sets while maintaining ease of use.
Is there a refund policy for StatPecker?
Yes, StatPecker offers a 10-day refund policy for its paid plans, allowing users to request a refund with no questions asked if they are not satisfied with the service. This ensures that users can try the platform without financial risk.
Alternatives
Fusedash Alternatives
Fusedash is an AI-powered data visualization platform that falls within the Analytics & Data and Business Intelligence categories. It helps teams convert their raw data into actionable insights through clear dashboards and charts, promoting a unified workspace where metrics and KPIs are consistently applied across various reports and views. Users often seek alternatives to Fusedash for several reasons, including pricing, specific feature sets, or varying platform requirements that better fit their organizational needs. When choosing an alternative, it's essential to consider factors such as ease of use, integration capabilities, scalability, and the ability to provide real-time insights while maintaining data accuracy and consistency.
StatPecker Alternatives
StatPecker is an innovative AI-powered tool that falls under the category of analytics and data visualization. It enables users to transform raw data into visually captivating infographics quickly, making it an essential platform for content creators, analysts, marketers, and educators. Users often seek alternatives to StatPecker for various reasons, including pricing concerns, specific feature requirements, or the need for compatibility with different platforms. When looking for an alternative, it is essential to consider factors such as the ease of use, the range of visualization options, the ability to integrate with existing tools, and overall cost-effectiveness. Additionally, assessing the level of customer support and community resources can help ensure a smoother transition to a new data visualization solution.