Skippership vs StatPecker
Side-by-side comparison to help you choose the right product.
Skippership
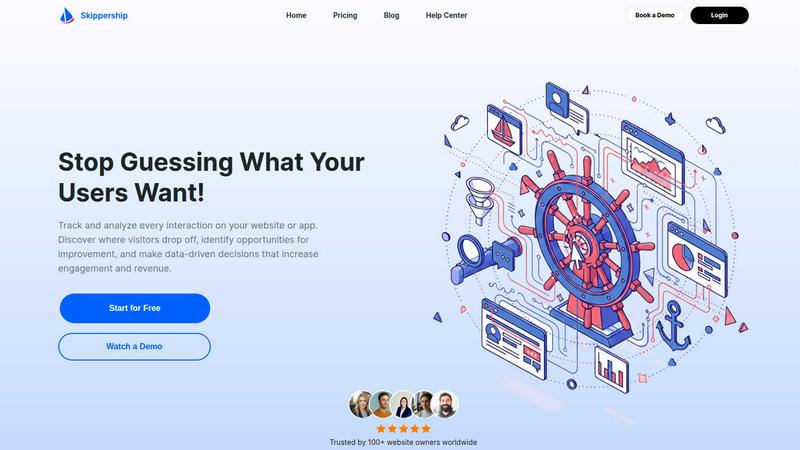
Skippership uses AI to analyze user behavior and identify friction points, boosting engagement and conversions on your.
Last updated: March 1, 2026

StatPecker
StatPecker provides fast AI insights and stunning visuals to enhance your data storytelling and presentations.
Last updated: March 1, 2026
Visual Comparison
Skippership
StatPecker

Feature Comparison
Skippership
Session Replays
Session replays allow users to watch real-time recordings of actual user interactions on their site. This feature helps uncover friction points, usability issues, and conversion blockers by providing a clear view of the entire user journey. This insight enables teams to take confident, data-driven actions for optimization.
Heatmaps
Skippership's heatmaps visually represent user engagement, showing where users click, scroll, and spend their time on pages. By highlighting areas that are frequently overlooked, heatmaps empower teams to optimize their content and layout, ultimately boosting user engagement and conversion rates.
Goal Tracking
With goal tracking, users can easily monitor key actions such as signups, purchases, and clicks. This feature allows teams to measure performance, identify patterns, and gain real-time insights into what actions drive conversions, facilitating targeted strategies for growth.
AI Analytics
The AI-powered analytics feature transforms data into clear insights by spotting patterns in user behavior. This functionality helps teams make quicker, data-driven decisions that enhance user engagement, strengthen retention, and lead to improved business outcomes, all based on actionable intelligence.
StatPecker
Ask Your Query
StatPecker allows users to pose questions to the AI and receive instant insights from validated sources. This feature simplifies the data exploration process, enabling users to generate answers without the need for complex tools or technical knowledge.
Publish & Embed
With StatPecker, users can create interactive visuals that can be seamlessly integrated into blogs, articles, and websites. This feature enhances the user experience by allowing for dynamic data presentations that engage audiences.
Upload & Analyze CSVs
Users can upload local CSV files (up to 50 MB) and leverage StatPecker's on-device analysis capabilities. This feature ensures that data remains private while allowing users to extract key insights without the hassle of traditional spreadsheets.
Download & Use Anywhere
StatPecker enables users to export their infographics as images for use in reports, presentations, and other formats. This flexibility allows for easy sharing and utilization of visuals across different platforms and mediums.
Use Cases
Skippership
E-commerce Optimization
E-commerce platforms can utilize Skippership to identify where customers drop off during the checkout process. By analyzing session replays and heatmaps, teams can discover specific friction points that hinder sales, enabling them to refine the user experience and boost conversion rates.
UX Design Improvements
UX designers can leverage Skippership to gain insights into user interactions on their sites. By reviewing session recordings and heatmaps, they can pinpoint usability issues and refine design elements, leading to a more intuitive and engaging user experience.
Marketing Campaign Analysis
Marketing teams can use Skippership to track the effectiveness of their campaigns by monitoring user interactions. By analyzing goal tracking data, they can assess which marketing strategies drive conversions and optimize future campaigns based on real-world user behavior.
Product Development Insights
Product managers can benefit from Skippership by understanding how users interact with their products. By leveraging AI-powered insights and session replays, they can identify pain points and prioritize features or fixes that will enhance user satisfaction and retention.
StatPecker
Content Creation
Content creators can utilize StatPecker to quickly generate stunning infographics that enhance their articles and blogs. By transforming data into visually appealing formats, they can capture their audience's attention more effectively.
Market Analysis
Analysts can leverage StatPecker to extract trends from data sets and visualize global comparisons. This capability allows them to present insights in a clear and compelling manner, facilitating better decision-making within their organizations.
Educational Presentations
Educators can harness StatPecker to create engaging visual aids for their lectures and presentations. By using infographics, they can simplify complex information, making it easier for students to grasp key concepts.
Team Collaboration
StatPecker enables teams to collaboratively analyze data and create infographics that can be shared internally. This feature enhances communication and alignment around data-driven insights, leading to more informed strategies and decisions.
Overview
About Skippership
Skippership is an innovative, AI-powered user behavior analytics platform tailored to eliminate uncertainty in digital optimization. It serves website and app owners, product managers, UX designers, and marketing teams by providing a comprehensive toolkit to monitor, analyze, and understand every user interaction on their platforms. The platform integrates session recordings, interactive heatmaps, goal and funnel tracking, and journey analysis into one user-friendly dashboard. The main value proposition of Skippership lies in its ability to transform raw data into actionable intelligence. Its advanced AI engine autonomously reviews session recordings, interprets user behaviors, identifies friction points such as checkout errors or rage clicks, and highlights critical issues while suggesting practical solutions in real-time. This functionality allows teams to swiftly determine why visitors abandon their journeys, discover avenues for enhancement, and make informed, data-driven decisions that enhance user engagement, improve retention, and elevate conversion rates. With a commitment to zero complexity and maximum clarity, Skippership empowers businesses of all sizes to optimize their digital experiences efficiently.
About StatPecker
StatPecker is an innovative AI-powered tool designed to transform raw data into visually captivating infographics in mere seconds. This platform caters to a diverse range of users, including content creators, analysts, marketers, and educators, all of whom aspire to enhance their storytelling through effective data visualization. By eliminating the need for manual reporting or hiring expensive designers, StatPecker streamlines the process of data storytelling. Users can focus on generating insights rather than struggling with complex software. The core value proposition of StatPecker lies in its ability to save time and reduce costs while significantly enhancing the impact of data presentations. By providing quick, credible answers that can be published, presented, or shared with teams, StatPecker empowers users to communicate data effectively and engagingly. Whether you are looking to extract trends or visualize global comparisons, StatPecker is an essential tool for anyone aiming to make data-driven decisions and presentations.
Frequently Asked Questions
Skippership FAQ
What makes Skippership different from other analytics tools?
Skippership stands out due to its AI-powered insights that automatically analyze user sessions, highlight friction points, and suggest actionable solutions in real-time, making it easier for teams to understand and improve user experiences.
Is Skippership easy to integrate with existing systems?
Yes, Skippership can be integrated with over 50 platforms, allowing you to unify your tech stack and streamline workflows without disrupting your existing processes.
How does Skippership ensure data privacy and security?
Skippership prioritizes user privacy and security by employing SSL/TLS encryption and adhering to GDPR and CCPA compliance standards. The platform only processes necessary data and never handles personal or sensitive information.
Can Skippership support teams of all sizes?
Absolutely. Skippership is designed to be customizable and scalable, making it suitable for businesses of any size, from small startups to large enterprises, ensuring that everyone can benefit from its comprehensive analytics capabilities.
StatPecker FAQ
How does StatPecker ensure data privacy?
StatPecker employs on-device analysis for CSV uploads, meaning that your data remains on your device during processing. This feature ensures that no sensitive information is shared over the internet.
Can I use StatPecker for free?
Yes, StatPecker offers a free tier that allows users to engage in unlimited projects and embeds, along with a limited number of AI queries and CSV uploads. This makes it accessible for users who want to explore the tool without any initial investment.
What types of files can I upload to StatPecker?
Users can upload CSV files up to 50 MB in size. This flexibility allows for the analysis of substantial data sets while maintaining ease of use.
Is there a refund policy for StatPecker?
Yes, StatPecker offers a 10-day refund policy for its paid plans, allowing users to request a refund with no questions asked if they are not satisfied with the service. This ensures that users can try the platform without financial risk.
Alternatives
Skippership Alternatives
Skippership is an AI-powered user behavior analytics platform that helps website and app owners optimize their digital experiences by identifying and resolving user friction points. It falls under the analytics and data category, providing a comprehensive suite of tools that includes session replays, heatmaps, and funnel tracking. Users often seek alternatives to Skippership for various reasons, such as pricing considerations, specific feature sets, or the need for compatibility with their existing platforms. When looking for an alternative, it is essential to consider factors such as the range of analytics tools offered, the ease of integration with current systems, and the overall user experience provided by the platform. Additionally, evaluating the level of customer support and the ability of the tool to provide actionable insights will help ensure that any chosen alternative meets the specific needs of your business.
StatPecker Alternatives
StatPecker is an innovative AI-powered tool that falls under the category of analytics and data visualization. It enables users to transform raw data into visually captivating infographics quickly, making it an essential platform for content creators, analysts, marketers, and educators. Users often seek alternatives to StatPecker for various reasons, including pricing concerns, specific feature requirements, or the need for compatibility with different platforms. When looking for an alternative, it is essential to consider factors such as the ease of use, the range of visualization options, the ability to integrate with existing tools, and overall cost-effectiveness. Additionally, assessing the level of customer support and community resources can help ensure a smoother transition to a new data visualization solution.