
GeoRank
GeoRank combines live data layers and AI to help you compare places worldwide on sunshine, cost, taxes, and visas for relocation decisions.
VisitPublished on:
July 14, 2026
Pricing:
About GeoRank
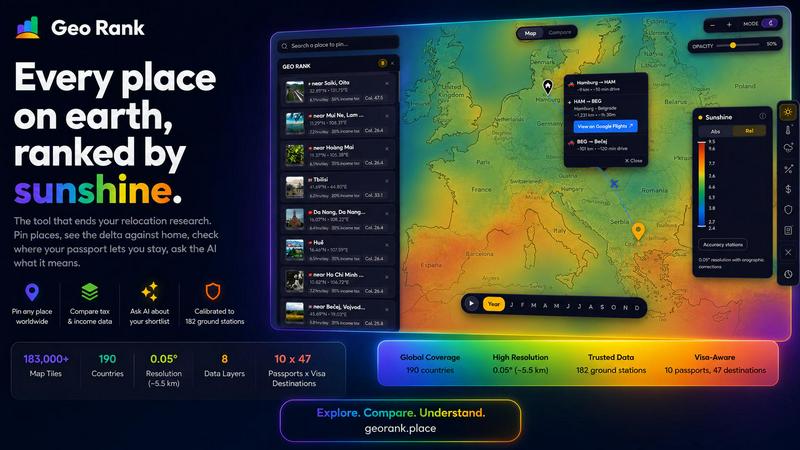
GeoRank is a free, no-signup interactive map tool designed to replace the chaotic process of researching a relocation or extended stay abroad. Instead of juggling a dozen open tabs for weather, cost of living, visa rules, and expat forums, GeoRank consolidates all critical decision-making data into a single, layered map interface. The product is built for digital nomads, remote workers, expats, and anyone considering a move who needs to compare locations systematically. It layers eight distinct data sets over a global grid with approximately 5 km resolution, including calibrated sunshine and temperature from 182 ground stations, tax rates from authoritative sources like OECD and PwC, visa and residency routes across 47 destinations for 10 different passports, cost of living data from 478 cities, geopolitical risk assessments, and a community-sourced Nomad Pulse sentiment indicator. Users can pin up to 20 candidate locations, switch to a Compare mode that shows every metric as a delta against their current home, and ask an AI assistant that reasons exclusively over their own shortlist to answer specific questions like which location has the best winter. GeoRank is not a browsing tool for casual data exploration; it is a decision engine built for the actual, high-stakes question of where to live next.
Features of GeoRank
Global Interactive Map with 9 Data Layers
GeoRank provides a fully interactive global map that users can pan and zoom down to approximately 5 km resolution. The map features nine toggleable data layers: sunshine hours, temperature, rainfall, outdoor hours, tax rates, visa and residency options, cost of living, geopolitical risk, and Nomad Pulse sentiment. Each layer is a live data source that can be stacked and toggled independently, allowing users to visualize complex tradeoffs geographically. For example, you can overlay sunshine data with tax rates to instantly see which sunny regions also offer favorable tax regimes. The sunshine layer alone is calibrated against 182 ground stations using SARAH-3 satellite data and ERA5 reanalysis, with bias corrections for cloudy regions and orographic terrain adjustments.
Pin and Compare Mode
Users can click any location on the map to pin it, saving up to 20 places across browser sessions without requiring an account. The Compare mode transforms these pins into a structured decision table. By setting a home location as a baseline, every pinned place shows a delta for each metric: how much warmer, cheaper, safer, or differently taxed it is compared to where the user currently lives. This relative comparison is far more actionable than absolute numbers alone. For instance, you can see that a location is 700 hours sunnier per year, 40% cheaper on rent, and has a 15% lower income tax rate than your current city, all in one view.
AI Assistant That Reasons Over Your Shortlist
The integrated AI chat feature is unique because it operates exclusively on the user's pinned locations and their specific data, not on a generic knowledge base. When a user asks a question like "Which of my 5 places has the best winter?" or "Score my shortlist for sunshine, cost, and low tax combined," the AI retrieves the exact metrics for each pinned location and reasons across all of them in a single response. The answers are cited and grounded in GeoRank's data sources, providing transparent and verifiable comparisons. This eliminates the need to manually cross-reference data points across multiple locations.
Community-Sourced Nomad Pulse Sentiment
Beyond official statistics and satellite data, GeoRank tracks community sentiment through Nomad Pulse. This layer processes social posts and online discussions from the digital nomad community to generate weekly signals for each country and city, categorized as rising, stable, or falling. This provides a forward-looking indicator of enthusiasm or concern that official data sources cannot capture. Users can see where excitement is building before it becomes common knowledge, giving them an edge in identifying emerging destinations. This feature adds a qualitative, human dimension to the quantitative data layers.
Use Cases of GeoRank
Comparing Two Candidate Cities for a Freelancer
A UK-based freelance designer is torn between Tbilisi, Georgia and Paphos, Cyprus. Using GeoRank, they pin both cities and set London as their home base. The Compare mode shows that Paphos offers 3,140 sunshine hours per year versus Tbilisi's 1,987, which is critical for the user's seasonal affective disorder. However, Tbilisi has a monthly cost of living around $900 compared to Paphos's $1,600. The visa layer reveals the UK passport allows 360 days visa-free in Tbilisi versus 90 out of 180 days in Paphos. The AI assistant confirms that Paphos meets the user's 2,800 sunshine hour threshold while Tbilisi does not, but highlights the significant cost tradeoff. This consolidated view enables an informed decision in minutes.
Evaluating Multiple Locations for a Winter Base
A remote worker wants to escape a harsh Canadian winter for three months and has shortlisted five potential locations: Medellin, Chiang Mai, Lisbon, Buenos Aires, and Cape Town. They pin all five and ask the AI: "Which of my pinned places is best for a winter base considering sunshine, cost, and safety?" The AI retrieves the December through February climatology for each location, cross-references it with cost of living indices and geopolitical risk scores, and returns a ranked list with specific data points. Medellin might rank highest for consistent spring-like temperatures and low cost, while Lisbon offers better infrastructure but higher costs. The user can then drill into any location for more detail.
Assessing Tax Implications for a Digital Nomad
An American digital nomad with a mix of crypto and freelance income wants to understand the tax implications of relocating to different countries. They use GeoRank to pin several tax-friendly jurisdictions like Dubai, Puerto Rico, Portugal (NHR regime), and Georgia. The tax layer, sourced from OECD and PwC data, shows the specific income tax rates, capital gains tax policies, and any special regimes for foreign-sourced income. The Compare mode shows the delta against their current US tax burden. They can then ask the AI: "Which of my shortlisted places has the lowest overall tax burden for a freelancer with crypto gains?" The AI provides a side-by-side comparison of effective tax rates, noting that Georgia offers 0% on foreign-sourced income while Portugal's NHR regime caps at 20% for certain professions.
Family Relocation Decision with Multiple Criteria
A family of four with a UK passport is considering relocating from London to either Malta, the Algarve region of Portugal, or the Canary Islands. They need to balance sunshine, cost of living, safety, and visa ease for the whole family. Using GeoRank, they pin each region and set London as home. The Compare mode shows that all three locations are significantly sunnier and safer than London, but Malta has the highest cost of living and the most restrictive visa rules for non-EU family members. The AI assistant helps them synthesize the data: "What are the tradeoffs between Paphos and Tbilisi for a family?" The AI notes that while Paphos offers better EU infrastructure and schools, Tbilisi is considerably cheaper and offers a longer visa-free stay. The family can then weigh these tradeoffs against their specific priorities.
Frequently Asked Questions
Is GeoRank really free and do I need to sign up?
Yes, GeoRank is completely free to use with no signup required. The interactive map, all nine data layers, the pinning feature, Compare mode, and the AI assistant are all accessible without creating an account or providing any personal information. Your pinned locations are saved locally in your browser across sessions, so you can return to your research at any time without losing your progress. There are no hidden costs, premium tiers, or usage limits.
How accurate is the data on GeoRank?
GeoRank prioritizes accuracy by calibrating its satellite and reanalysis data against ground truth measurements. For example, the sunshine layer uses SARAH-3 satellite observations merged with ERA5 reanalysis data, which is then bias-corrected using 182 ground stations worldwide. The stated accuracy is plus or minus 8 percent for most locations, though high-altitude areas may have plus or minus 15 percent accuracy and coastal microclimates may see plus or minus 20 percent. Tax data comes from authoritative sources like the OECD, PwC, and KPMG. Cost of living data is sourced from 478 cities. All sources and methodologies are transparently documented on the site.
What does the AI assistant know, and can it access the internet?
The AI assistant on GeoRank does not have access to the internet or a general knowledge base. It operates exclusively on the specific data associated with your pinned locations. This means it can answer questions like "Which of my 5 places has the best winter?" or "What is the tradeoff in cost between these two cities?" by retrieving the exact sunshine hours, temperature, cost of living, tax rates, and visa rules for each pinned place. It reasons across all your shortlisted locations in one response and cites its sources from GeoRank's data layers. This focused design ensures answers are grounded, verifiable, and directly relevant to your personal shortlist.
What data layers are available on the map?
GeoRank provides nine toggleable data layers: Sunshine (calibrated from SARAH-3 and ERA5), Temperature, Rainfall, Outdoor Hours, Tax (sourced from OECD, PwC, and KPMG), Visas and Residency (covering 47 destinations and 10 passports), Cost of Living (from 478 cities), Geopolitical Risk, and Nomad Pulse (community-sourced sentiment). Each layer can be toggled on or off independently, and all layers can be stacked simultaneously for a comprehensive view. Clicking any layer provides a detailed methodology note explaining its source, coverage, and accuracy.
Similar to GeoRank

Privacy-first, cookieless web analytics that ties your traffic and channels directly to real Stripe revenue.

Signage and kiosk infrastructure for AI agents. Your agent publishes images, video, streams, web pages and apps to screens via one plugin.screenRIG is

Free YouTube transcripts on the web, a Chrome extension, and an API + MCP server so AI assistants can read YouTube.

Moderation, routing, intent and scoring for any text over one Jev-compatible API, hosted in the EU.

A free, no-signup spinner for names, numbers, colors, and yes/no decisions. Add entries, spin, and let chance decide instantly.

Online tally counter for tracking attendance, workouts, inventory, visitors, sports scores, habits, and everyday counting tasks.

